L2 data products
L2s are the lowest level data products available to the scientific community consisting of calibrated data in spacecraft and geophysical coordinates with ephemeris and attitude data. Refer to the TRACERS Rules of Use while working with these data products
ACE
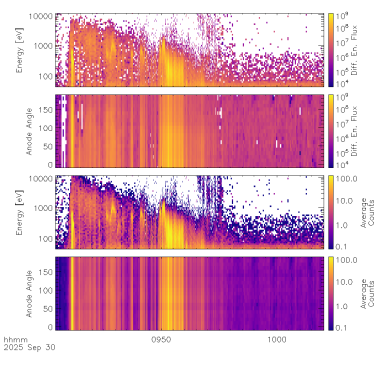
The ACE L2 data consist of raw measured counts and calibrated differential energy fluxes as a function of anode angle and calibrated energy. Counts are accumulated in 21 discrete anodes with different viewing angles for each of 49 energy steps, with a basic measurement cadence of 50 ms. Counts are converted to differential energy flux by subtracting an estimate of the background and then dividing by the instrument calibration matrix. The estimated background count rates and calibration matrix are included in the L2 data files, enabling application of alternative background subtraction methods or calibrations.
Background estimates include two sources: 1) Instrumental background due to electronics crosstalk, which is constant across all anodes but varies with energy. 2) Natural background due to penetrating energetic particles and natural radioactivity in the microchannel plate detectors, which is constant across all anodes and energies. Subtraction of background can lead to negative differential energy fluxes, especially for low count rate data. Depending on the use case, these negative values can either be retained or replaced with zeroes. The calibration matrix incorporates instrument sensitivity and relative sensitivity factors for each anode, both estimated based upon a combination of pre-flight laboratory calibrations and inflight data. Energy values for each energy step and anode are computed utilizing the known sweep voltage table and pre-flight laboratory calibrations.
NOTE: The ACE instrument was intended to be operated in a particular spacecraft orientation, with the TSCS +Z axis aligned with the magnetic field. In this orientation, incoming electron trajectories are not occluded by the spacecraft. However, for a portion of the TRACERS mission, the spacecraft are oriented in the opposite sense, which leads to an occlusion of a portion of the instrument field of view by the spacecraft body for low-energy (<~200 eV) electrons. Low-energy ACE data should not be utilized for quantitative purposes when the spacecraft are in this orientation.
ACI
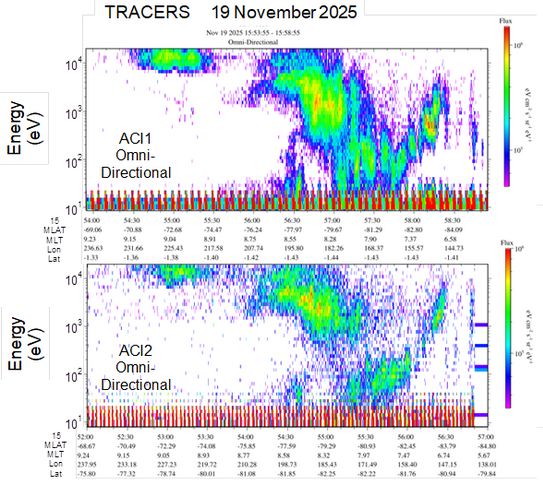
ACI is a toroidal top-hat electrostatic analyzer on a spinning platform that provides full angular coverage with instantaneous 22.5 degrees x approximately 6 degrees angular resolution for a single energy step. ACI covers an ion energy range from approximately 8 eV/e to 20,000 eV/e in 47 logarithmically spaced energy steps with a fractional energy resolution of approximately 10%. It provides reasonably high-cadence (312 ms) measurements of ion flux and energy-dependent pitch angle distributions with a 5-order-of-magnitude sensitivity, enabling detection of cusp boundaries and characterization of cusp ion steps.
The ACI L2 data consists of differential energy flux as a function of epoch, energy (47 bins), and look angle (16 directions). In addition, errors in the differential energy flux are provided. Finally, the differential energy flux is ordered by pitch angle. Pre-environmental calibration of both ACI units involved determining instrument response factors, such as MCP Gain, discriminator thresholds, and energy and solid-angle coverage and resolution. Unfortunately, not all the updates from the on-ground testing were applied in flight from the start of the mission, and changes to settings were in place by 1/15/2026. Work is ongoing to characterize the differences in the gain/counting between the 2 instruments to allow for more direct comparisons; however, we are aware of differences between the units of at least a factor of 2.
NOTE: The uncertainty in the absolute fluxes is large (on the order of a factor of 2 or more). Please consult with the ACI team for further direction.
EFI
The electric fields instrument (EFI) consists of spin-plane double probes oriented in the ± X and ± Y axes. The probes are current-biased and make measurements at several cadences to provide observations of plasma waves and structures from DC up to 10 MHz.
At the lowest frequency range, EFI makes measurements at 128 samp/s (S/s) (8 samp/s in the back orbit). These measurements are DC-coupled to the plasma and are intuitively called the EDC and VDC L2 products. The VDC L2s consist of the four calibrated probe potentials in the TRACERS spinning frame with minimal signal processing and noise reduction. Interpretation likely requires the actual current biases, which can be found in the housekeeping L2 product, HSK (see Table 2 in the EFI SSR instrument paper linked below). The EDC L2s are three-axis measurements of the electric field from potential differences between probe pairs and have been transformed into many coordinate frames. For this product, the 3rd axis is deduced by making the MHD assumption that the electric field component along the magnetic field is null. This assumption is reasonable for the region of the ionosphere in which TRACERS flies. The vxB electric field induced from the motion of the spacecraft through ambient magnetic fields has also been calculated from the IGRF and subtracted. Finally, the product contains fits of the electric field over a spin (or multiple spins) using the LASSO regression method.
For higher frequencies, EFI produces 2.048 ksamp/s (one 0.5 s snapshot every 16 s in back orbit) data in the EAC L2 and a 20 Msamp/s snapshot every 16 s (one 0.8192 ms snapshot every 2048 s in back orbit) in the EHF L2. The EAC L2 product includes two-axis time series data in the spinning TRACERS frame (because the MHD assumption above is not generally valid for plasma waves). Beyond a time series calibration, no further processing of the data has been performed, although a table is included that provides the complex transfer function (i.e. gain- and phase-frequency response) for the instrument’s analog filters. The EHF L2 product consists of both the time series waveform and spectra of a single axis (aligned with TRACERS X axis). Like the EAC product, no further processing is performed and the complex transfer function is included in a table. Note that the spectra have not been adjusted to include this transfer function.
MAG (TBC)
MSC
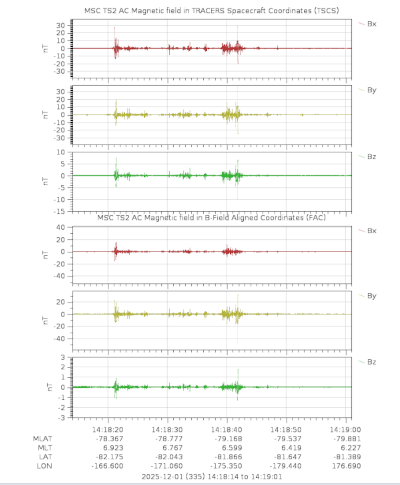
Level-2 (L2) MSC data products are the 3-axis waveforms sampled at 2048 samples per second and calibrated at 100 Hz for amplitude. The data are available in the CDFs with TSCS (spacecraft) coordinates and field aligned coordinates (FAC). See left Figure for an example of the MSC L2 data.
NOTE: If the FAC data is missing for a period in a MSC L2 CDF, we are currently lacking the definitive spacecraft ephemeris data for that period which is needed to produce the FAC data. These MSC L2 CDFs will be updated as we obtain the ephemeris data.
Calibration Notes: All L2 Waveform products are calibrated in amplitude at 100 Hz only. There is no phase calibration applied at this stage. Before using these waveforms to process wave parameters, or to produce fully calibrated spectrograms, please follow the calibration process described below.
L2 Waveform data is amplitude-calibrated at 100 Hz. There are amplitude deviations at other frequencies, and there are phase shifts which are not reflected in the L2 data at all. The phase shift is a frequency-dependent shift in the phase of the observed wave relative to the input wave, tantamount to a time delay at that frequency. The L2 data can be adjusted over frequency by applying dimensionless complex factors over frequency immediately after Fourier transforming the L2 data. The Variable " ts2_cal_freq_response" in the CDF consists of a table for the MSC sensor. Each table has 16384 entries. The Variables are "frequency" (contains the associated frequencies of the calibration coefficients); “real” (the real component of the calibration); "imaginary" (the imaginary component of the calibration), and “magnitude” (the gain factor difference for that frequency compared to 100 Hz). The values extend from 0.0625 Hz to 1024 Hz, in steps of 0.0625 Hz. The table is constructed assuming 32768 data points are to be FFT'ed. If fewer than that are to be transformed, then the table can be decimated to accommodate a shorter data set. The procedure is; FFT the L2 data at the desired resolution and then perform a complex division of the FFT'ed dataset with the MSC calibration table.