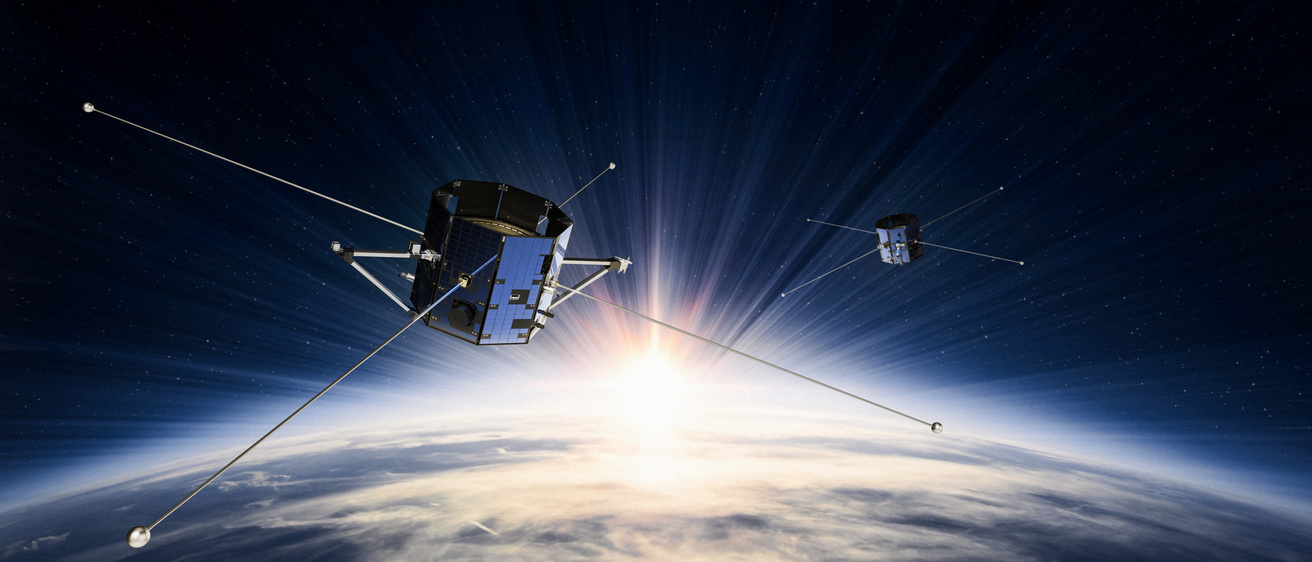
Banner image credit: Millennium Space Systems
The ion measurements of the ACI instruments are critical in distinguishing between magnetopause reconnection that is spatially vs. temporally variable. ACI measurements are central to the first two TRACERS science objectives.
How ACI works
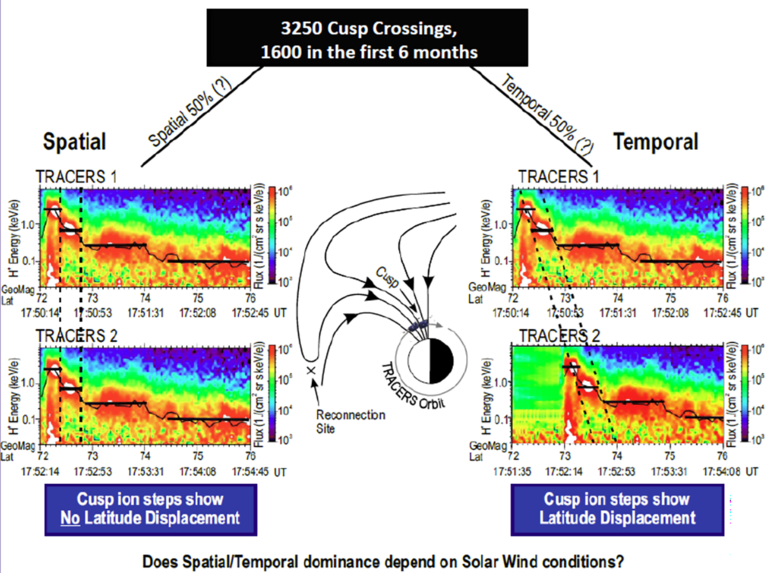
When flying through the cusp, TRACERS will observe dispersion signatures where the highest energy ions are seen at the lowest latitudes (the equatorward edge of the cusp). This energy dispersion is rarely smooth, often consisting of 'steps' where the ion energy is constant for a short range of latitude and then decreases to the next step.
These steps are central to understanding if reconnection is spatially or temporally variable. By measuring the steps separately on both TRACERS spacecraft, we can determine the nature of reconnection variability. Simply put, if the steps occur at the same latitude on both spacecraft, then reconnection is spatially variable; if the steps move in latitude (that is, to higher latitude), then reconnection is temporally variable.
Technical details
Technical details
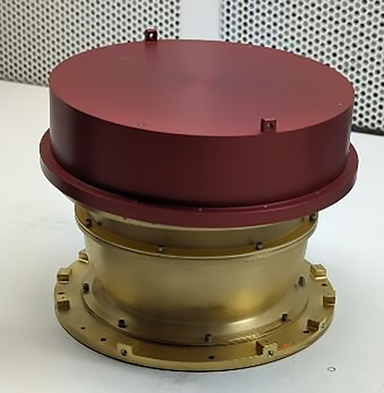
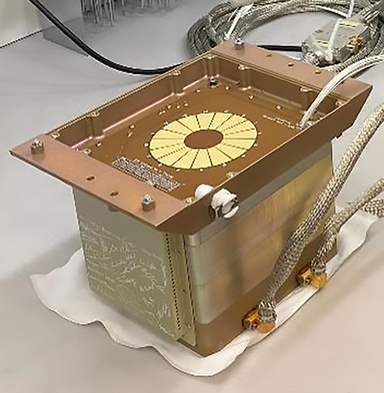
ACI measures 3-D ion velocity distributions from ~10 eV to 20 keV. Every 0.3 seconds, it produces a 2-D energy spectrum over this energy range. When TRACERS is in the cusp, ACI combines these energy spectra to determine the cusp ion dispersion signatures that are critical to distinguishing temporal versus spatial reconnection variability.
This measurement is central to the first two science objectives for the mission.
| parameter | performance |
|---|---|
| Temporal Resolution per Sample | .312 s |
| Energy Range | 8 – 20,000 eV |
| Energy Resolution | 17% ΔE/E FWHM |
| Angular Coverage per Sample | 360° x 10° |
| Angular Coverage per Spacecraft Spin | Full 4π sr |
| Angular Resolution | 22.5° x 10° |
| Sensitivity (Differential Energy Flux) | 103– 5x10⁸ eV/[cm2 s sr eV] |
How we got to ACI
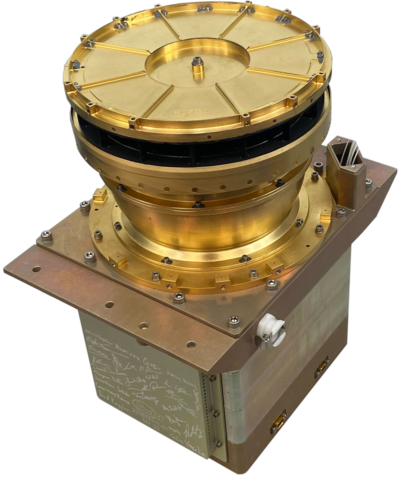
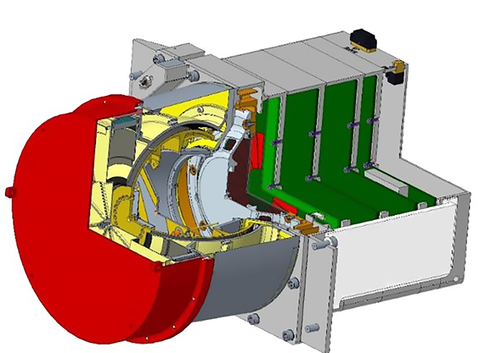
ACI has direct heritage from the TRICE-II sounding rockets mission as well as the Hot Plasma Composition Analyzer (HPCA) instrument on NASA's Magnetospheric Multiscale (MMS) mission.
The ACI instrument is based on a standard top-hat electrostatic analyzer design. The ACI sensor measures energy-angle distributions every 0.3 seconds and has excellent energy resolution and coverage at high cadence.